Showing posts with label google spreadsheets. Show all posts
Showing posts with label google spreadsheets. Show all posts
Wednesday, May 27, 2009
Show-n-Tell gadget in honor of GoogleIO
Find out more about this gadget... or, If you see nothing above this message, or you just don't get this whole post... please excuse me and move on to your next critical task for today. ;)

Friday, May 8, 2009
Stock Screen Revisit - howz that doin' anyway?
 I posted back in February about a stock screen I ran using Google Finance - to pick stocks which seemed to have gotten beat up in the market while still having no debt and consistent income growth. (if you look at that link now - it will show the current stocks which meet the criteria I set, not the same stocks as on Jan 27th when I originally ran it).
 I realized today that I hadn't revisited that to see how that list of stocks has performed against the market...
Well - here's the deal.
On Jan 27th, 2009, the Dow was at 8174. The S&P 500 was at 846.
On May 8th, 2009, the Dow closed at 8575. The S&P was at 929.
That's a total increase of: 4.9% for the Dow and 9.8% for the S&P 500.
On Jan 27th, 2009, my list of stocks was valued at: $21,929.
On My 8th, 2009, that list of stocks was valued at: $27,351.
That's a total increase of: 24.7%.
oh. ok. So now what? I'll just hop into my time machine - go back to Jan 27th and actually invest? nah. I'm so tired of that time machine. I think it's time to try that same screen a few times... basically it says that stocks that were beat down, which still have some fundamental value and no debt, MIGHT perform better than the market as a whole... Or, at least it did in this one instance... by a healthy margin.
(and, again, I'm not giving any financial advice here, and if historic results were any indication of future results, you might get lucky once or twice, but in the long run you'd lose your shirt most likely).
[Update: here's a link if you want more info on the spreadsheet itself]
My Dad would have loved this... he would have played with it for hours and then he'd go check in on his friends at Silicon Investor to see what they thought... and then he'd make some pretty great trades. I only mention that because I'm thinking about him all day today, this 2nd anniversary of the day he left us to toil away in the markets (and this life) without his incredible love and guidance. Damn.
Saturday, May 2, 2009
Chart your Twitter Tweetquency
 I follow a few people on Twitter who pretty much make me feel like I'm with them every step of their day... and I follow some who tweet so infrequently, that I feel lucky if I catch what they say between all the other blabber. That made me think that it might be interesting to see a chart of how frequently we tweet - our Tweetquency. As many of you know, I just can't help myself sometimes - I have to do everything on a spreadsheet.
 Click the image to see a view-only version of this spreadsheet.
You can also click here to get your own copy of this spreadsheet which you can edit and play with.
I expect to be playing lots more with this, but here's how this simple version was done... I created a spreadsheet with two sheets. In one sheet (the second one in the file), I used the Twitter API to pull in what's called a user timeline - the same thing you see when you click on a user's screen name in Twitter. This is done using the =ImportFeed() function in Google Docs. The actual formula looks like this:
=importfeed("http://twitter.com/statuses/user_timeline.atom?screen_name=" & B1, "items", true)
- where cell B1 holds the user screen name I want to grab.
[note - I also tried to have a count - to pull in a certain number of tweets, but that doesn't seem to work - so this spreadsheet actually is totally dependent on puling in 20 tweets at a time right now - and does the formula 5 times to get 100 tweets to play with. Look at that second sheet and scroll down a bit to look for the repetitive formulas and you'll see this hack.]
Then I have a second sheet (which is actually the main/first sheet you see) which is basically the user interface - it allows you to enter a screen name and shows you the chart once the data in that other sheet is collected.
It's fun to enter a name of someone you follow, just to show you something visually that you already know - that they either blab all the time, or hardly ever ;)
For now, this only looks at the prior 99 tweets... but I'll likely be posting some updates and new versions of this TwitSheet... so let me know if you have other ideas or watch this space...
Monday, February 9, 2009
Embed a form in your blog post to collect data fast
In a recent post regarding using forms to collect data easily, a couple of people thought I should have used my own advice for one of the collection methods - that is, to embed the actual form in a web page - in my blog post in this case. Great idea...
So - below is an embedded version of my Blogging Survey. Took me literally 30 seconds to get the embed code from the "Form" menu of the spreadsheet. This is just a sample survey, but feel free to answer this survey and I'll post results soon if I get enough respondents.
So - below is an embedded version of my Blogging Survey. Took me literally 30 seconds to get the embed code from the "Form" menu of the spreadsheet. This is just a sample survey, but feel free to answer this survey and I'll post results soon if I get enough respondents.
Wednesday, February 4, 2009
Small Business Web Tip: Collect data quickly using a web form
At the Small Business Technology Summit this week, I was asked "what's the one action these small businesses can do today to have an impact on their business" (I put that in quotes - but I'm sure I've tweaked the question a bit to match my answer ;).
I answered, "Create a form - a survey - for free, which you can email to your customers to immediately find out what they think of your product or service". A bunch of people asked me for more information - so I figured it would be useful to post a quick "Web Tip" here... If you don't feel like reading, there are also plenty of public videos on this topic done by others.
If you want to first get a sense of what one of these Forms would look like, you can answer my example survey about blogging. If you do, try to really answer it, and maybe we'll get some useful results I can share.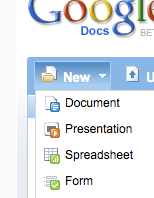
The below might seem like a bunch of steps, but this can literally take 10 minutes - it's the thinking about which questions to ask and what multiple choice questions to offer, which is the hard and important part.
How to collect data for free using Google Docs Forms:
Step 1:
Go to Google Docs - http://docs.google.com
Sign-in or get an account. You need a google account, but that doesn't mean a Gmail account necessarily (see my old video on that topic).
You should see your list of Docs - if you've used the service before - or an empty list (which, actually then, isn't a list at all if there's nothing in it... it's just a frame)

Step 2:
Click the "New" dropdown button on the upper left - and choose "Form".
You'll be taken to a new window which is the "Form Editor". It starts you off with an automatic first question called "Name" - just to remind you that you may want to ask (optionally) for the respondants name - and leaves you in edit mode on question #2.
When editing the form - you edit one question at a time (click the pencil button on the right) and click "done" as you finish setting up each question.
At this point you can go back and edit the first question (example - add some help text to tell people that "Name is optional, but helps me know who you are").
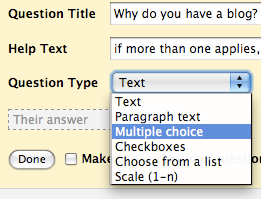
The default field type is "Text" - but you *should* use multiple choice or scale questions where possible - as those give great quantitative summaries - and if you want people to type a more descriptive answer, change the question type to "paragraph text".
Step 3:
Finish entering all your questions and click the "Save" button at the top. Keep the form rather short if possible - nobody likes to answer a long survey - and you won't want your second survey to be ignored if you decide to do another one in a few weeks/months.
Step 4:
Make your own confirmation message. After someone responds to your form, they get a generic "Thanks!" message - but you can edit that to create your own message.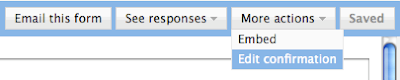 You can include valid URLs to have a link on that page. At the top of the form editor, there is a "More Actions" button. Click that and select the option "Edit Confirmation".
Step 5:
Send the form! You have a few ways to get the form into the hands of your potential respondents:
1 - Send the form using email... If you select the "email this form" option, you can enter the email addresses of respondents and they will get the form EMBEDDED in their email message if they use Gmail or Yahoo mail (those are the only popular mail systems which allow that) - or - they will get a link to a separate web page which contains your form.
2 - Embed the form on your blog or website. The other option in the "more actions" button is "embed" - that gives you the HTML code you can embed in your blog post, blog template or website so people can answer the form directly from there.
3 - Get the URL of the form and IM/mail it directly to your potential respondents. The URL can be copied from the bottom of the form editor screen, where it says "You can view the published form here:".
Step 6:
Go see your form. Click on that link at the bottom of the Form Editor to make sure your form looks as you intended. That's how others will see it. [NOTE: You can test the form, but there is currently an issue where the form response count will not be reset, even if you remove your test response]
Step 7:
See your responses! The form you created actually created a spreadsheet in the background. After saving your form - close that form editor window and go back to your Google Docs list. Find your form/spreadsheet on the docs list and click it to open it. You'll see a spreadsheet with the questions you asked as the column headers (with one additional column as the first, which is the timestamp of each reply). If you already sent the form out, the spreadsheet may already contain responses which have been received. If you hang out there for a while, you may even see responses appear in real time (that's fun).
Step 8:
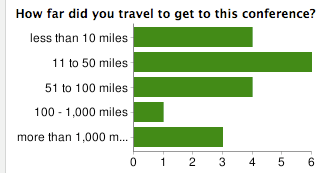
See your reponse summary. From the spreadsheet, click on the "Form" menu at the top and click on "Show Summary". That takes you to a page which summarizes, in chart format where feasible, the responses to each question.
Step 9:
Set up notifications so that you know when people respond to your form.
Click the "Share" button (on the upper right of the spreadsheet window) and select "Set notification rules". In that dialog, select the options "[when] A user submits a form", and choose either "Email - dialy digest" or "Email - right away", depending on how many responses you expect to get and how much you want to spam yourself.
Some Tips:
> *Do not* try to re-arrange the questions on the spreadsheet itself. There are issues where the form and the spreadsheet get out of sync if you do that. Re-arranging should be done from the form editor only - where questions can be dragged and dropped into the order you want them.
> There is not yet a way to restrict people to filling out the form only once.
> *Do not* "PUBLISH" the resulting spreadsheet or set it to "Anyone can view" unless that's really what you need. Those settings are NOT necessary to make the form broadly available, and it might let people see the results of the survey which you may not have intended.
> If you are HTML-ready, you can take the Form page and tweak the HTML to give it style or additional logic - just *never* change the POST URL or the NAME ATTRIBUTES on the HTML form object in that page. You'll also need your own place to host the updated HTML page. This isn't something you'll be able to get much support on from the Google Docs help center - so only do this if you are feeling lucky ;)
Have fun!
I answered, "Create a form - a survey - for free, which you can email to your customers to immediately find out what they think of your product or service". A bunch of people asked me for more information - so I figured it would be useful to post a quick "Web Tip" here... If you don't feel like reading, there are also plenty of public videos on this topic done by others.
If you want to first get a sense of what one of these Forms would look like, you can answer my example survey about blogging. If you do, try to really answer it, and maybe we'll get some useful results I can share.

The below might seem like a bunch of steps, but this can literally take 10 minutes - it's the thinking about which questions to ask and what multiple choice questions to offer, which is the hard and important part.
How to collect data for free using Google Docs Forms:
Step 1:
Go to Google Docs - http://docs.google.com
Sign-in or get an account. You need a google account, but that doesn't mean a Gmail account necessarily (see my old video on that topic).
You should see your list of Docs - if you've used the service before - or an empty list (which, actually then, isn't a list at all if there's nothing in it... it's just a frame)

Step 2:
Click the "New" dropdown button on the upper left - and choose "Form".
You'll be taken to a new window which is the "Form Editor". It starts you off with an automatic first question called "Name" - just to remind you that you may want to ask (optionally) for the respondants name - and leaves you in edit mode on question #2.
When editing the form - you edit one question at a time (click the pencil button on the right) and click "done" as you finish setting up each question.
At this point you can go back and edit the first question (example - add some help text to tell people that "Name is optional, but helps me know who you are").

The default field type is "Text" - but you *should* use multiple choice or scale questions where possible - as those give great quantitative summaries - and if you want people to type a more descriptive answer, change the question type to "paragraph text".
Step 3:
Finish entering all your questions and click the "Save" button at the top. Keep the form rather short if possible - nobody likes to answer a long survey - and you won't want your second survey to be ignored if you decide to do another one in a few weeks/months.
Step 4:
Make your own confirmation message. After someone responds to your form, they get a generic "Thanks!" message - but you can edit that to create your own message.
 You can include valid URLs to have a link on that page. At the top of the form editor, there is a "More Actions" button. Click that and select the option "Edit Confirmation".
Step 5:
Send the form! You have a few ways to get the form into the hands of your potential respondents:
1 - Send the form using email... If you select the "email this form" option, you can enter the email addresses of respondents and they will get the form EMBEDDED in their email message if they use Gmail or Yahoo mail (those are the only popular mail systems which allow that) - or - they will get a link to a separate web page which contains your form.
2 - Embed the form on your blog or website. The other option in the "more actions" button is "embed" - that gives you the HTML code you can embed in your blog post, blog template or website so people can answer the form directly from there.
3 - Get the URL of the form and IM/mail it directly to your potential respondents. The URL can be copied from the bottom of the form editor screen, where it says "You can view the published form here:".
Step 6:
Go see your form. Click on that link at the bottom of the Form Editor to make sure your form looks as you intended. That's how others will see it. [NOTE: You can test the form, but there is currently an issue where the form response count will not be reset, even if you remove your test response]
Step 7:
See your responses! The form you created actually created a spreadsheet in the background. After saving your form - close that form editor window and go back to your Google Docs list. Find your form/spreadsheet on the docs list and click it to open it. You'll see a spreadsheet with the questions you asked as the column headers (with one additional column as the first, which is the timestamp of each reply). If you already sent the form out, the spreadsheet may already contain responses which have been received. If you hang out there for a while, you may even see responses appear in real time (that's fun).

Step 8:
See your reponse summary. From the spreadsheet, click on the "Form" menu at the top and click on "Show Summary". That takes you to a page which summarizes, in chart format where feasible, the responses to each question.
Step 9:
Set up notifications so that you know when people respond to your form.
Click the "Share" button (on the upper right of the spreadsheet window) and select "Set notification rules". In that dialog, select the options "[when] A user submits a form", and choose either "Email - dialy digest" or "Email - right away", depending on how many responses you expect to get and how much you want to spam yourself.
Some Tips:
> *Do not* try to re-arrange the questions on the spreadsheet itself. There are issues where the form and the spreadsheet get out of sync if you do that. Re-arranging should be done from the form editor only - where questions can be dragged and dropped into the order you want them.
> There is not yet a way to restrict people to filling out the form only once.
> *Do not* "PUBLISH" the resulting spreadsheet or set it to "Anyone can view" unless that's really what you need. Those settings are NOT necessary to make the form broadly available, and it might let people see the results of the survey which you may not have intended.
> If you are HTML-ready, you can take the Form page and tweak the HTML to give it style or additional logic - just *never* change the POST URL or the NAME ATTRIBUTES on the HTML form object in that page. You'll also need your own place to host the updated HTML page. This isn't something you'll be able to get much support on from the Google Docs help center - so only do this if you are feeling lucky ;)
Have fun!
Saturday, January 31, 2009
Last Minute, Automated-ish, Superbowl Pool

It's the Saturday before Superbowl Sunday - and you wish you had created a box pool for you and your friends. Too late, right? Nah... anything is possible... (if you've never been in a superbowl box pool - either stop reading or read on to check it out).
Here's an online way to do it (I know there are "real" sites for this): I created a SuperBowl Box Pool spreadsheet which has an online FORM for people to quickly participate... People fill out the form and they get assigned a random box in the pool - then, when all boxes are taken (there's 100 boxes, so it's ok to take more than one), the score values are randomly assigned and the names are again shuffled...
Then, as I enter the scores at the end of each quarter, the winners are identified automatically (as if that would be too hard to do by hand - sometimes I'm almost pathetic in my need to create useless spreadsheet formulas)
If you want to play in my pool (just for fun... no "points" to be won here!), just FILL OUT MY FORM and then go SEE THE BOX POOL to see which random boxes.
If you want your own - just go to THE SAMPLE and make your own copy (File menu, "create a copy" option... you'll need a Google Docs account).
If I get 100 boxes filled, I'll post the winner here after the Superbowl!
[Update: If you use the sample to run one of these on your own, be careful once the box numbers are generated... as they could easily be re-generated in-advertently if a change is made to the sheet which forces a re-calc - like inserting columns or other things. This shouldn't impact anything until you generate the random score numbers ... Once you take that startup step as per the instructions, don't touch the thing except to enter scores ;) and PRINT IT to be sure... ]
[Update 2/2/2008: And the winner was - Curious George. I would have won the half-time score, which is no wonder since I had to take almost half the boxes between myself and people close enough that they may as well have been me... Well - maybe I'll start collecting players for 2010 ;) ]
Saturday, September 27, 2008
Spreadsheet visualization of industry-sector political contributions
The Sunlight Foundation posted a great video showing how money has flowed into the Republican and Democratic parties from different industry sectors over time. In normal circumstances, I might have said "(yawn) pass the nuts"... but... they used the Motion Chart in Google spreadsheets to visually show the changes in these flows over time. If you love data, whether you're politically interested or not, you gotta love this visualization... I'm embedding it here for convenienve... full credit to Sunlight for this specific video, to Gapminder team and the Trendalyzer (Motion Chart) team at Google responsible for this great chart type and to Yossi for pointing this example my way ;)
From the Sunlight Foundation Blog:
The gadget gallery has this chart type and others where you can get your own examples to play with...
From the Sunlight Foundation Blog:
The gadget gallery has this chart type and others where you can get your own examples to play with...
Friday, September 26, 2008
An unexpected political post with an expected spreadsheet
I never talk or post politics - but on this eve of the first presidential debate, after a semi-wild week of news (semi? huh...), I figured I may as well fix up that electoral vote calculator I've been toying with and let others have a go at it...
If you want your own copy in your Google Docs account - there's a link at the top of the full published version. With your own copy, you can change who you think will win each state to see the impact on the electoral vote.... quite fun.
Summary - according to CNN as of Sept 26, 2008:
The initial data comes from CNN's Political Site - just after this first presidential debate which took place tonight between Barack Obama and John McCain. There, they have an electoral vote map - showing which states are either strong or leaning to one candidate or the other, or undecided. On their map, you can click the state to change the result.
If you want your own copy in your Google Docs account - there's a link at the top of the full published version. With your own copy, you can change who you think will win each state to see the impact on the electoral vote.... quite fun.
Summary - according to CNN as of Sept 26, 2008:
| See the full version... |
The initial data comes from CNN's Political Site - just after this first presidential debate which took place tonight between Barack Obama and John McCain. There, they have an electoral vote map - showing which states are either strong or leaning to one candidate or the other, or undecided. On their map, you can click the state to change the result.
Saturday, May 31, 2008
Spreadsheets are sexy?
The Google IO conference got plenty of press coverage, as this CNet video proves... It was actually a fun interview, but what was i doing with my hands? Is it better to lock them behind my back or let them fly around uncontrollably in front of me? ;)
In another video, a local reporter with independent station KRON4 in CA used some special effects (ok, just some editing) to avoid my flying monkey arms... See that video clip on the KRON4 site - Tech Report with Gabriel Slate (what a cool name).
The two things I liked about this conference: First, it really did feel a bit like a day at Google (with a little bit more junk food than normal), and second, the focus seemed to stay with educating developers rather than getting across a corporate message.
me? biased? probably... but trying not to be.
In another video, a local reporter with independent station KRON4 in CA used some special effects (ok, just some editing) to avoid my flying monkey arms... See that video clip on the KRON4 site - Tech Report with Gabriel Slate (what a cool name).
The two things I liked about this conference: First, it really did feel a bit like a day at Google (with a little bit more junk food than normal), and second, the focus seemed to stay with educating developers rather than getting across a corporate message.
me? biased? probably... but trying not to be.
Monday, March 24, 2008
Convert Anything on a spreadsheet
Ok, maybe not 'anything' - but pretty close... It uses a lesser known feature of the Google search box. For example, If you want to know how many feet there are in 12 meters, you type "12 meters in feet" and you get your answer. Or let's say your british friend tells you he has a friend who wants to get to know you better - and you say "describe him" and he says, "right... he's got a good personality, and...well... he weighs 14 stone". Of course, instead of seeming like a naive American (of course not, not you), you quickly go to the google search box and type "14 stone in pounds" and then decide... and maybe then you can use this same method to figure out how many USD (yes, that's dollars) you'll need to buy dinner in GBP (of course, that's pound sterling) - it's not a pretty answer.
Well - now that you know that trick - here's the real trick. In a spreadsheet (yes, on Google, of course) you can send that query to the Google search page in the background, get back the answer, parse it and display the answer in your spreadsheet. All this through the magic of the "ImportHTML()" formula.
I'm not going to go into the details of how to do that here - but I will give you a link to get your own copy of this sample spreadsheet (yes, you'll be asked to login to your google account, if you aren't already, to get this spreadsheet added to your doc list).
I must admit, I've had this fun thing (wha? you don't think this is fun?) lying around for a bit - but I figured I should clear the decks given that I've got some new ideas to post...
Well - now that you know that trick - here's the real trick. In a spreadsheet (yes, on Google, of course) you can send that query to the Google search page in the background, get back the answer, parse it and display the answer in your spreadsheet. All this through the magic of the "ImportHTML()" formula.
I'm not going to go into the details of how to do that here - but I will give you a link to get your own copy of this sample spreadsheet (yes, you'll be asked to login to your google account, if you aren't already, to get this spreadsheet added to your doc list).
I must admit, I've had this fun thing (wha? you don't think this is fun?) lying around for a bit - but I figured I should clear the decks given that I've got some new ideas to post...
Friday, September 21, 2007
Planning Trips Together
Planning trips can be fun...(Ha!) ...vacation trips, not business trips. But no matter what type of trip I'm planning, there's almost always a need to share the itinerary, if not the planning process itself, with other people. 
So, of course I see an opportunity to use a Google spreadsheet here (yes - I know Google Calendar is the more natural choice...). I was inspired by another spreadsheet I found online - where Disney trips specifically were being planned - to create a generic template that anyone could use to plan a trip. Knowing how hard that was (the Disney trip), I could relate to the value of having a 1-page view of the whole trip - particularly the meal reservations (don't get me started on that topic).
 The main feature of the template is the automatic creation of the "Agenda View", which is a shortened version of the schedule (yes - I know Google Calendar has the best Agenda view)... so as you fill in the Trip Planner matrix on the front page, the Agenda View is populated with that data. You could even share a link to the published version of that simpler Agenda View with people - and as you update your plans on the main page, they'll always see the most recent version (as long as you use the "automatically re-publish" option on the "publish" tab).
So, of course I see an opportunity to use a Google spreadsheet here (yes - I know Google Calendar is the more natural choice...). I was inspired by another spreadsheet I found online - where Disney trips specifically were being planned - to create a generic template that anyone could use to plan a trip. Knowing how hard that was (the Disney trip), I could relate to the value of having a 1-page view of the whole trip - particularly the meal reservations (don't get me started on that topic).
The main feature of the template is the automatic creation of the "Agenda View", which is a shortened version of the schedule (yes - I know Google Calendar has the best Agenda view)... so as you fill in the Trip Planner matrix on the front page, the Agenda View is populated with that data. You could even share a link to the published version of that simpler Agenda View with people - and as you update your plans on the main page, they'll always see the most recent version (as long as you use the "automatically re-publish" option on the "publish" tab).
Wednesday, September 5, 2007
Bloggers do it better than me...
The blogosphere rocks. (hey, Firefox spell checker doesn't recognize 'blogosphere'!... and it asked me to capitalize 'Firefox' ;).
We launch some new features in spreadsheets, and the pro-bloggers provide some super-fast discovery, analysis, tie-ins to other news... and then there's the reader comments, usually adding more value... it's just so consistent.... so follow the above links rather than depend on me to provide the details...
We launch some new features in spreadsheets, and the pro-bloggers provide some super-fast discovery, analysis, tie-ins to other news... and then there's the reader comments, usually adding more value... it's just so consistent.... so follow the above links rather than depend on me to provide the details...
Thursday, July 5, 2007
Don't wait for a feature - write it yourself...
Had to share this, for those of you who don't see the Google Docs & Spreadsheets blog... A spreadsheet filter application was developed using the Spreadsheets API by an intern (go Alex!) on the spreadsheets team. Really valuable when you often work with just a few rows in those large-ish spreadsheets which have many (many!) rows of data...
This app lets you create a bookmarkmarklet (that's a bookmark created by dragging a link to your bookmark bar on your browser) to any of your spreadsheets... it should be self-explanatory - but you basically just feed it the URL of your favorite published spreadsheet...
This app lets you create a bookmarkmarklet (that's a bookmark created by dragging a link to your bookmark bar on your browser) to any of your spreadsheets... it should be self-explanatory - but you basically just feed it the URL of your favorite published spreadsheet...
Sunday, April 29, 2007
See your spreadsheet as a draggable timeline
Thanks to a chance online stumbling across Kiyo's Blog (ok, "chance online stumbling" is more like a link in my email triggered by a google alert for 'google spreadsheet' ;), I discovered this really cool open source timeline widget in the form of a Sample Timeline using a Google spreadsheet. So it was a double bonus for me.. a cool widget and, even better, a great use case for the spreadsheets API !
Now I could have discovered this earlier if I watched everything that came out the developer pages of Google - as this widget was highlighted previously as a
Google Code Sample related to using Google Calendar API.... but Kiyohito Yamamoto saved me the trouble of both recognizing the opportunity and then coding a spreadsheet-sourced timeline... Thanks Kiyo!
Now I could have discovered this earlier if I watched everything that came out the developer pages of Google - as this widget was highlighted previously as a
Google Code Sample related to using Google Calendar API.... but Kiyohito Yamamoto saved me the trouble of both recognizing the opportunity and then coding a spreadsheet-sourced timeline... Thanks Kiyo!
Subscribe to:
Posts (Atom)