Showing posts with label spreadsheet tips. Show all posts

Friday, June 12, 2009

Twitter search results are more useful in a spreadsheet

I know I've overstayed my welcome in this utterly boring space of Twitter API data in a spreadsheet - but I just have to share one more... This time, it's something that might actually be useful (omg, did I just admit that all the other stuff was useless? uh huh).

Let's say, for example, you are a product manager (hey - i know one of those) and you want to know who is tweeting about your product... You do a twitter search! Cool! It's really easy to see recent tweets about your product. You can page through the results, and, in some tools even see a quick info box on the specific Tweeters listed (like location, number of followers, etc). But - let's say you want to calculate the total "reach" or, as @psychemedia called it in a recent tweet, "amplification" of the tweets which match your search?

"There's an app...err... a spreadsheet for that" !

Here's what this spreadsheet does:

- Pulls the most recent (up to) 400 tweets which match your search terms (there's limits in the twitter search API how far in time that will go back) into the spreadsheet.

- It includes: the tweet text, author, date/time

- For the most recent 50 tweets, it pulls the number of followers for the person who tweeted somethhing that matched your search terms... and it adds those up and give you a "Distribution for the most recent 50 tweets". In other words - the number of people following the people who tweeted about the thing you searched for.

- For the most recent 50 tweets, it filters those which are ReTweets (RT) and sums the followers for the authors of those tweets - giving you a distribution of RTs of that concept or tweeter (this is meant mostly for searching for a tweeter's screen name to see the distribution of RTs of that persons tweets).

This is not rocket science (I realize) - but it forms a basis to allow you to:
> get a sense for the amplification of a specific term or product name or tweeter
> focus on the tweets in a search result set which were authored by highly-followed tweeters (if you are a PR/marketing/customer-service person in particular)
> do further stuff with this data that I haven't thought of or had time to do...

Like the other twitsheets I've done - this is just meant to be a starting point for people with a purpose... so if you come up with something useful from this, let me know!

Saturday, June 6, 2009

Twitter says: Coldplay follows the unpopular, Oprah doesn't

Coldplay follows 2,624 tweeters on twitter - who, on average, are only followed by 10 people each. Oprah on the other hand only follows 14 people, who, on average, are followed by 709,350 people (as of this post on 9 June, 2009). I know - I spent the past 14 weeks counting! Nah... actually - there's a cool way to do this in - yes, you guessed it - a spreadsheet.

In tweaking the TweeterScore and other TwitSheets I've discovered that using xpath, you can quickly summarize data from an XML feed into a spreadsheet... that is, you don't have to do the adding and looping yourself.
In one command, you can summarize data across all the entries in any XML feed.
For example... the twitter XML data for "friends statuses" (the recent tweets of all the people you follow) can be grabbed with a URL like this:
http://twitter.com/statuses/friends/whatsername.xml - and you can do that for any tweeter, to see the statuses of (and other stuff about) all the people they follow...

The actual XML data - in brief form - includes something like this (shortened massively):
<users>
  <user>
    <id>1010101</id>
    <name>Whatsher Name</name>
    <screen_name>Whatsername</screen_name>
    ...
    <followers_count>1031</followers_count>
    ...
    <status>
      <created_at>Tue Apr 07 22:52:51 +0000 2009</created_at>
      <id>1234567890</id>
      <text>brb - going to get ice cream now</text>
      <source><a href="http://www.tweetdeck.com/">TweetDeck</a>
      </source>
      ...
    </status>
  </user>
</users>

So - for the given tweeter (that you gave as the tweeter-screen-name.xml file name) it gives information for every other tweeter that person follows. A cool way to get the raw data for every person they follow. But the best part is the ability to summarize across all the entries... and XPath lets you do that.

Example: Let's say I wanted to know not just all the names of the people that Oprah follows (no idea why i picked her) - but I wanted to know the average number of people who follow the people she follows. That would tell me whether Oprah is following her fans (unpopular) or other celebs (popular, with lots of followers themselves).
I can do that in a spreadsheet in one command (almost).

I use the ImportXML() command with an XPath command string of "sum(/users/user/followers_count)" to get the total number of followers of all the people being followed by this tweeter... so for Oprah, the spreadsheet formula looks like this:
=importXML("http://twitter.com/statuses/friends/oprah.xml","sum(/users/user/followers_count)")
Divide that by the number of people she follows, and you have the average...
I'll leave it to you to check out this sample spreadsheet which does a whole bunch of this xml manipulation to compare 10 tweeters.

Saturday, February 21, 2009

Stock screening and watching for now

I figure there are some stock market bargains out there - somewhere - if you can find companies who's stock price is beat down but who have solid fundamental business measures... and, of course, if you'd otherwise be in Vegas, but can't afford to get there given the economy... So I tried something fun that seemed worth sharing...

I used the Google Finance stock screener to look for companies with:
- stock down more than 50% in the past year.
- Price/Earnings ratio between 0 and 10 (well priced (?), but still positive).
- Positive 5-year Net Income growth rate - still growing earnings.
- No Debt (debt to assets ratio of zero)

It's a really fun thing to do - since you can slide each of the screeners and see the number of companies change in real-time - and you can add criteria from a pretty large pre-selected list of data points.
Here's the exact stock screen I used.

On Jan 27, that screen produced 28 companies...including some old favorites like Ann Taylor, Build-a-bear and Garmin, amongst the others.

I copied and pasted the data into a Google spreadsheet (you knew that, didn't you) - and added a few columns to see what would have happened if I bought a bit of each...
For this first test, I didn't bother trying to weight the different stocks according to anything, not even to even out the amount invested - I just went simple and theoretically bought 100 shares of each... theoretically investing around $21k... and then I added a column to pull the current stock price of each of those 28 companies.

(see the whole spreadsheet here)
Results so far? Well - since Jan 27 through Feb 20, I'd have lost around $1,400 - or 6.5% of my investment... In that same period, the Dow lost 9.9% - so, as Bill Murray says, "uh, I got that goin' for me".

I just like the process - not sure I'll actually act on any of these self-found "tips" - but I like that I can easily find stocks which fit my own dreamed up criteria and then watch them easily in a spreadsheet...

If you want your own copy of that spreadsheet, go to this page where the spreadsheet itself is fully described.

(and, of course, I'm not giving any financial advice here, and if historic results were any indication of future results, you shouldn't listen to me anyway)

Wednesday, February 4, 2009

Small Business Web Tip: Collect data quickly using a web form

At the Small Business Technology Summit this week, I was asked "what's the one action these small businesses can do today to have an impact on their business" (I put that in quotes - but I'm sure I've tweaked the question a bit to match my answer ;).
I answered, "Create a form - a survey - for free, which you can email to your customers to immediately find out what they think of your product or service". A bunch of people asked me for more information - so I figured it would be useful to post a quick "Web Tip" here... If you don't feel like reading, there are also plenty of public videos on this topic done by others.

If you want to first get a sense of what one of these Forms would look like, you can answer my example survey about blogging. If you do, try to really answer it, and maybe we'll get some useful results I can share.
The below might seem like a bunch of steps, but this can literally take 10 minutes - it's the thinking about which questions to ask and what multiple choice questions to offer, which is the hard and important part.

How to collect data for free using Google Docs Forms:

Step 1:
Go to Google Docs - http://docs.google.com
Sign-in or get an account. You need a google account, but that doesn't mean a Gmail account necessarily (see my old video on that topic).

You should see your list of Docs - if you've used the service before - or an empty list (which, actually then, isn't a list at all if there's nothing in it... it's just a frame)


Step 2:
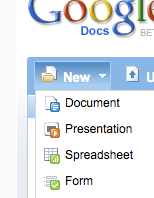
Click the "New" dropdown button on the upper left - and choose "Form".

You'll be taken to a new window which is the "Form Editor". It starts you off with an automatic first question called "Name" - just to remind you that you may want to ask (optionally) for the respondants name - and leaves you in edit mode on question #2.
When editing the form - you edit one question at a time (click the pencil button on the right) and click "done" as you finish setting up each question.

At this point you can go back and edit the first question (example - add some help text to tell people that "Name is optional, but helps me know who you are").
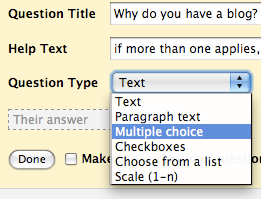
The default field type is "Text" - but you *should* use multiple choice or scale questions where possible - as those give great quantitative summaries - and if you want people to type a more descriptive answer, change the question type to "paragraph text".

Step 3:
Finish entering all your questions and click the "Save" button at the top. Keep the form rather short if possible - nobody likes to answer a long survey - and you won't want your second survey to be ignored if you decide to do another one in a few weeks/months.

Step 4:
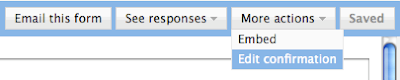
Make your own confirmation message. After someone responds to your form, they get a generic "Thanks!" message - but you can edit that to create your own message. You can include valid URLs to have a link on that page. At the top of the form editor, there is a "More Actions" button. Click that and select the option "Edit Confirmation".
Step 5:
Send the form! You have a few ways to get the form into the hands of your potential respondents:
1 - Send the form using email... If you select the "email this form" option, you can enter the email addresses of respondents and they will get the form EMBEDDED in their email message if they use Gmail or Yahoo mail (those are the only popular mail systems which allow that) - or - they will get a link to a separate web page which contains your form.
2 - Embed the form on your blog or website. The other option in the "more actions" button is "embed" - that gives you the HTML code you can embed in your blog post, blog template or website so people can answer the form directly from there.
3 - Get the URL of the form and IM/mail it directly to your potential respondents. The URL can be copied from the bottom of the form editor screen, where it says "You can view the published form here:".

Step 6:
Go see your form. Click on that link at the bottom of the Form Editor to make sure your form looks as you intended. That's how others will see it. [NOTE: You can test the form, but there is currently an issue where the form response count will not be reset, even if you remove your test response]

Step 7:
See your responses! The form you created actually created a spreadsheet in the background. After saving your form - close that form editor window and go back to your Google Docs list. Find your form/spreadsheet on the docs list and click it to open it. You'll see a spreadsheet with the questions you asked as the column headers (with one additional column as the first, which is the timestamp of each reply). If you already sent the form out, the spreadsheet may already contain responses which have been received. If you hang out there for a while, you may even see responses appear in real time (that's fun).

Step 8:

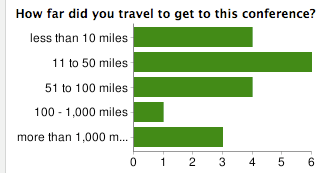
See your reponse summary. From the spreadsheet, click on the "Form" menu at the top and click on "Show Summary". That takes you to a page which summarizes, in chart format where feasible, the responses to each question.

Step 9:
Set up notifications so that you know when people respond to your form.
Click the "Share" button (on the upper right of the spreadsheet window) and select "Set notification rules". In that dialog, select the options "[when] A user submits a form", and choose either "Email - dialy digest" or "Email - right away", depending on how many responses you expect to get and how much you want to spam yourself.

Some Tips:

> *Do not* try to re-arrange the questions on the spreadsheet itself. There are issues where the form and the spreadsheet get out of sync if you do that. Re-arranging should be done from the form editor only - where questions can be dragged and dropped into the order you want them.

> There is not yet a way to restrict people to filling out the form only once.

> *Do not* "PUBLISH" the resulting spreadsheet or set it to "Anyone can view" unless that's really what you need. Those settings are NOT necessary to make the form broadly available, and it might let people see the results of the survey which you may not have intended.

> If you are HTML-ready, you can take the Form page and tweak the HTML to give it style or additional logic - just *never* change the POST URL or the NAME ATTRIBUTES on the HTML form object in that page. You'll also need your own place to host the updated HTML page. This isn't something you'll be able to get much support on from the Google Docs help center - so only do this if you are feeling lucky ;)

Have fun!

Monday, March 24, 2008

Convert Anything on a spreadsheet

Ok, maybe not 'anything' - but pretty close... It uses a lesser known feature of the Google search box. For example, If you want to know how many feet there are in 12 meters, you type "12 meters in feet" and you get your answer. Or let's say your british friend tells you he has a friend who wants to get to know you better - and you say "describe him" and he says, "right... he's got a good personality, and...well... he weighs 14 stone". Of course, instead of seeming like a naive American (of course not, not you), you quickly go to the google search box and type "14 stone in pounds" and then decide... and maybe then you can use this same method to figure out how many USD (yes, that's dollars) you'll need to buy dinner in GBP (of course, that's pound sterling) - it's not a pretty answer.

Well - now that you know that trick - here's the real trick. In a spreadsheet (yes, on Google, of course) you can send that query to the Google search page in the background, get back the answer, parse it and display the answer in your spreadsheet. All this through the magic of the "ImportHTML()" formula.

I'm not going to go into the details of how to do that here - but I will give you a link to get your own copy of this sample spreadsheet (yes, you'll be asked to login to your google account, if you aren't already, to get this spreadsheet added to your doc list).

I must admit, I've had this fun thing (wha? you don't think this is fun?) lying around for a bit - but I figured I should clear the decks given that I've got some new ideas to post...